You can connect Snowflake CoCo, formerly Cortex Code, to Cube through the Model Context Protocol (MCP) or the Cube command-line interface (CLI). CoCo can then query governed data and build workbooks and dashboards in Cube.
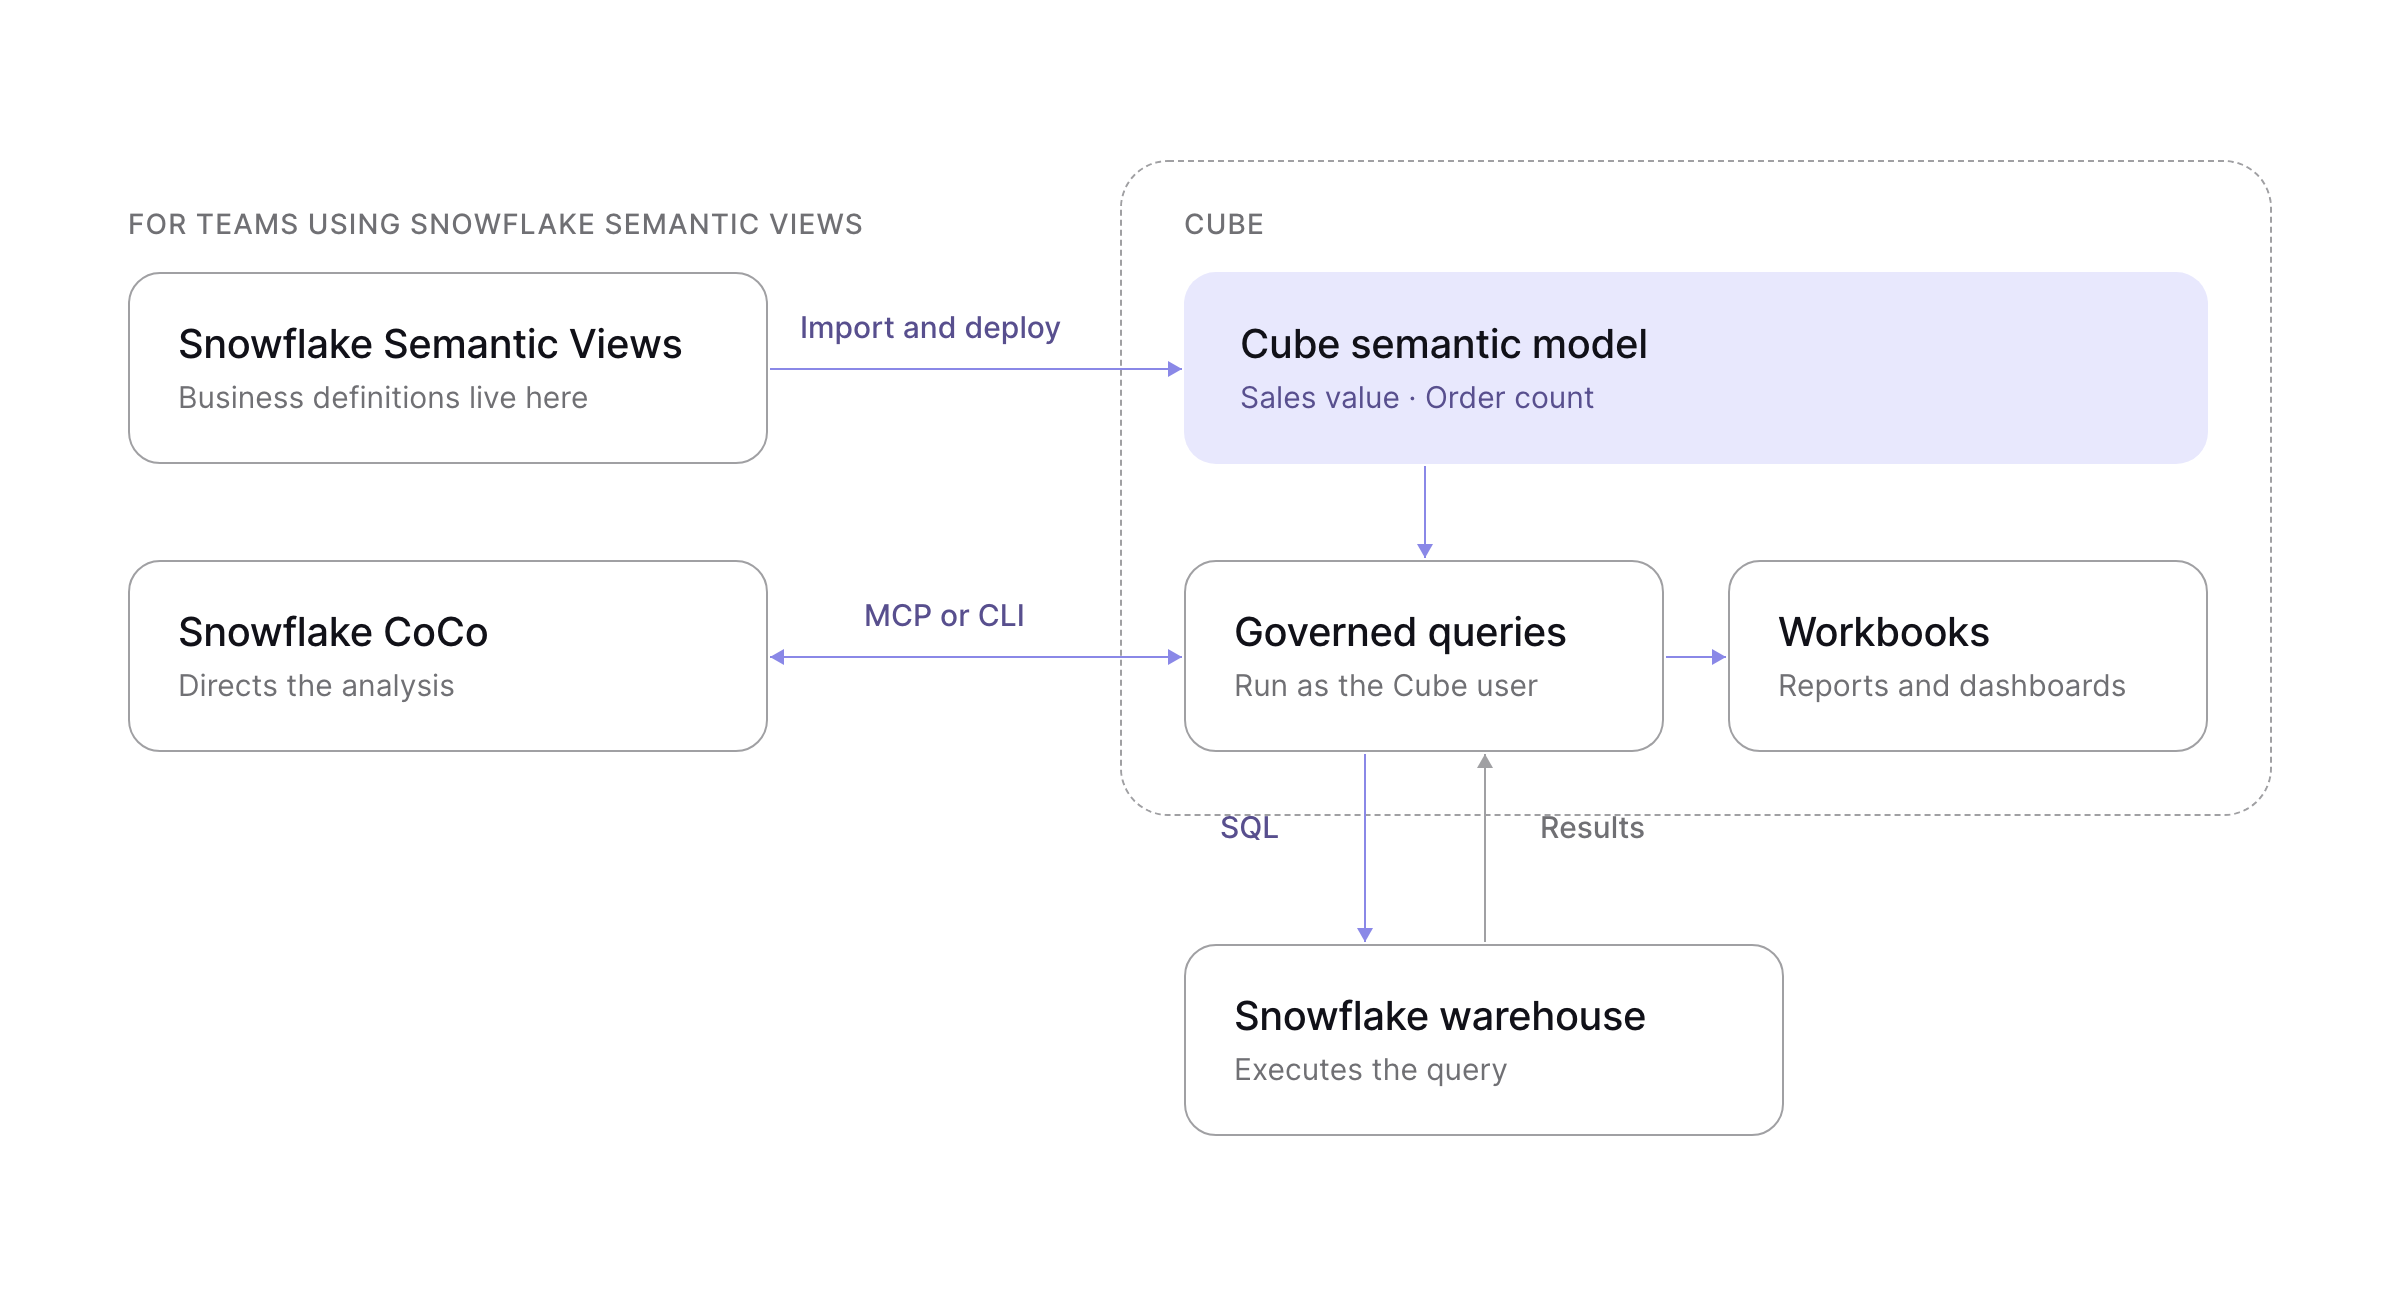
If your team already defines metrics in Snowflake and uses CoCo for analysis, I think Cube should fit that workflow. You should be able to keep authoring definitions in Snowflake and use CoCo to build reports and dashboards that your team can explore and share in Cube.
We're building Cube as an agentic analytics platform where people and agents work with the same models, reports, and dashboards. The demo below shows CoCo exploring an existing e-commerce model in Cube and building a dashboard for revenue and orders.
Start with your Snowflake definitions
Use Cube's Snowflake Semantic Views integration to import your definitions. Select the views in the Cube IDE, review the generated model files, and deploy them for analysis.
Your data team can continue authoring definitions in Snowflake. When a definition changes, bring the updated model into Cube and validate the resulting queries.
The model tells CoCo which transactions a measure includes. A sum of line-item sale prices, for example, needs a status filter if the analysis should exclude canceled or returned items.
Let CoCo direct the analysis
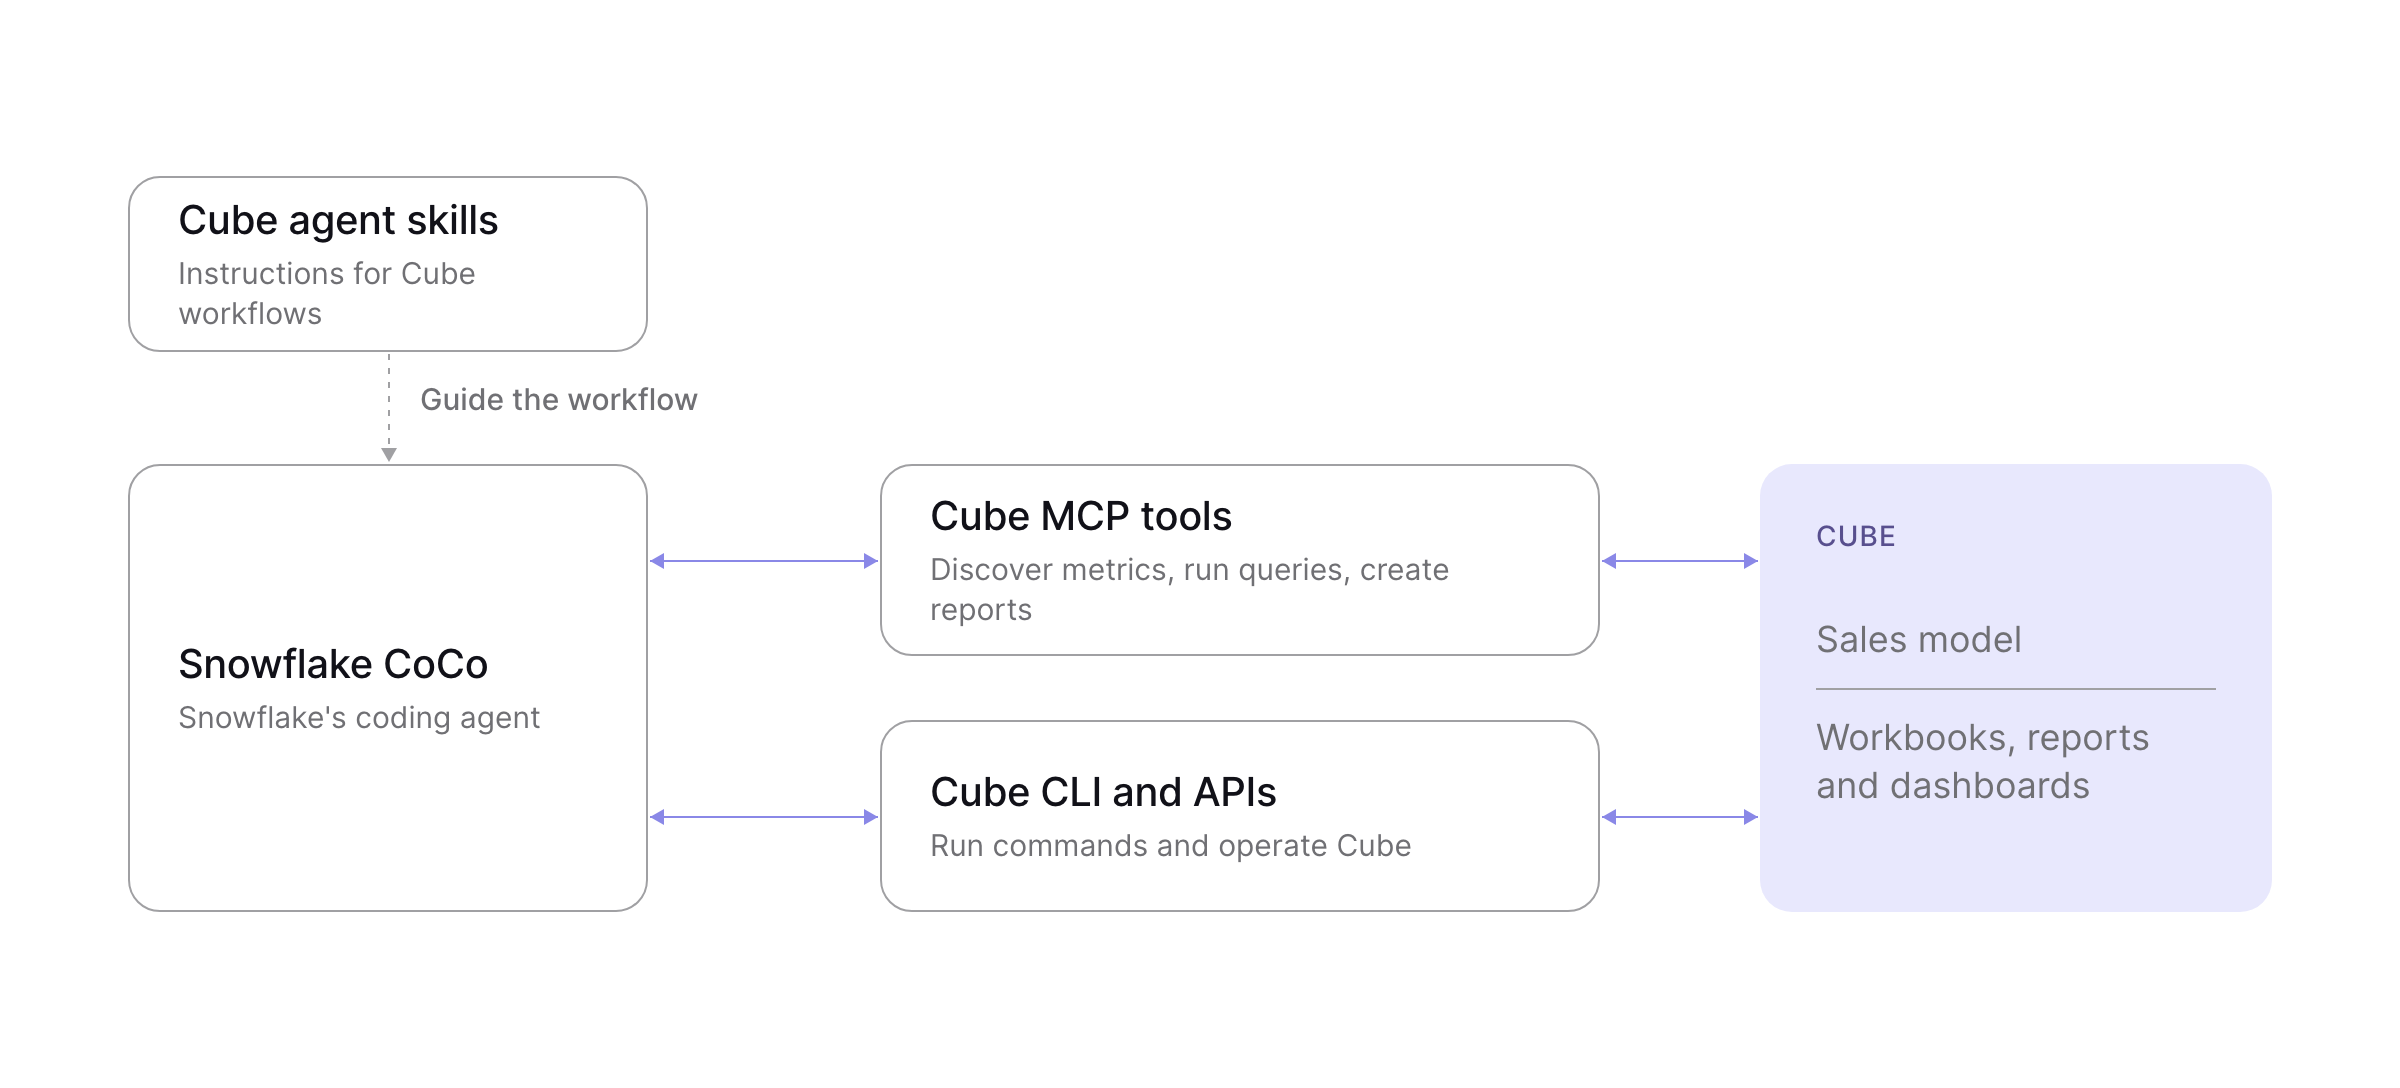
CoCo can use Cube's direct MCP tools to discover measures and dimensions, run queries, and save reports. CoCo decides what to investigate and interprets the results. Cube handles query execution and stores the resulting reports and dashboards.
searchDataModel finds available metrics, and runQuery returns the requested data. Both run with the connected Cube user's permissions. Use these direct tools to keep CoCo directing the analysis. Cube's separate chat tool delegates a question to a Cube agent.
Connect the tools
Connect CoCo through MCP for direct tool calls, or through the Cube CLI for terminal commands. Agent skills build on the CLI with instructions for common Cube workflows.
MCP
In Cube, open Admin → MCP Server and check deployment access. Then register Cube with the CoCo CLI:
Configure OAuth for the server in ~/.snowflake/cortex/mcp.json using Cube's client ID cube-mcp-client and scope mcp-agent-access. CoCo supports discovering the authorization server from the endpoint. Run cortex mcp start, complete the browser sign-in, and use /mcp in your CoCo session to check the connection.
The CLI and agent skills
We published Cube agent skills alongside our Claude Connector as open-source instructions for working with Cube through the CLI. CoCo supports their SKILL.md format.
Install the Cube CLI and sign in:
Copy the skill directories from skills/ in the Cube agent skills repository into your project's .cortex/skills/ directory. Start CoCo from that project and check the available skills with /skill list.
Use cube-explore-model to inspect the model, cube-run-query to query it, and cube-build-content to create workbooks, reports, and dashboards. The skills guide CoCo through the Cube CLI and APIs, including authentication checks and query validation before saving content.
From analysis to a dashboard
Can you build me a dashboard in Cube?
CoCo can inspect your model and existing workbooks, then ask what the dashboard should focus on. For an e-commerce model, you might choose revenue and orders.
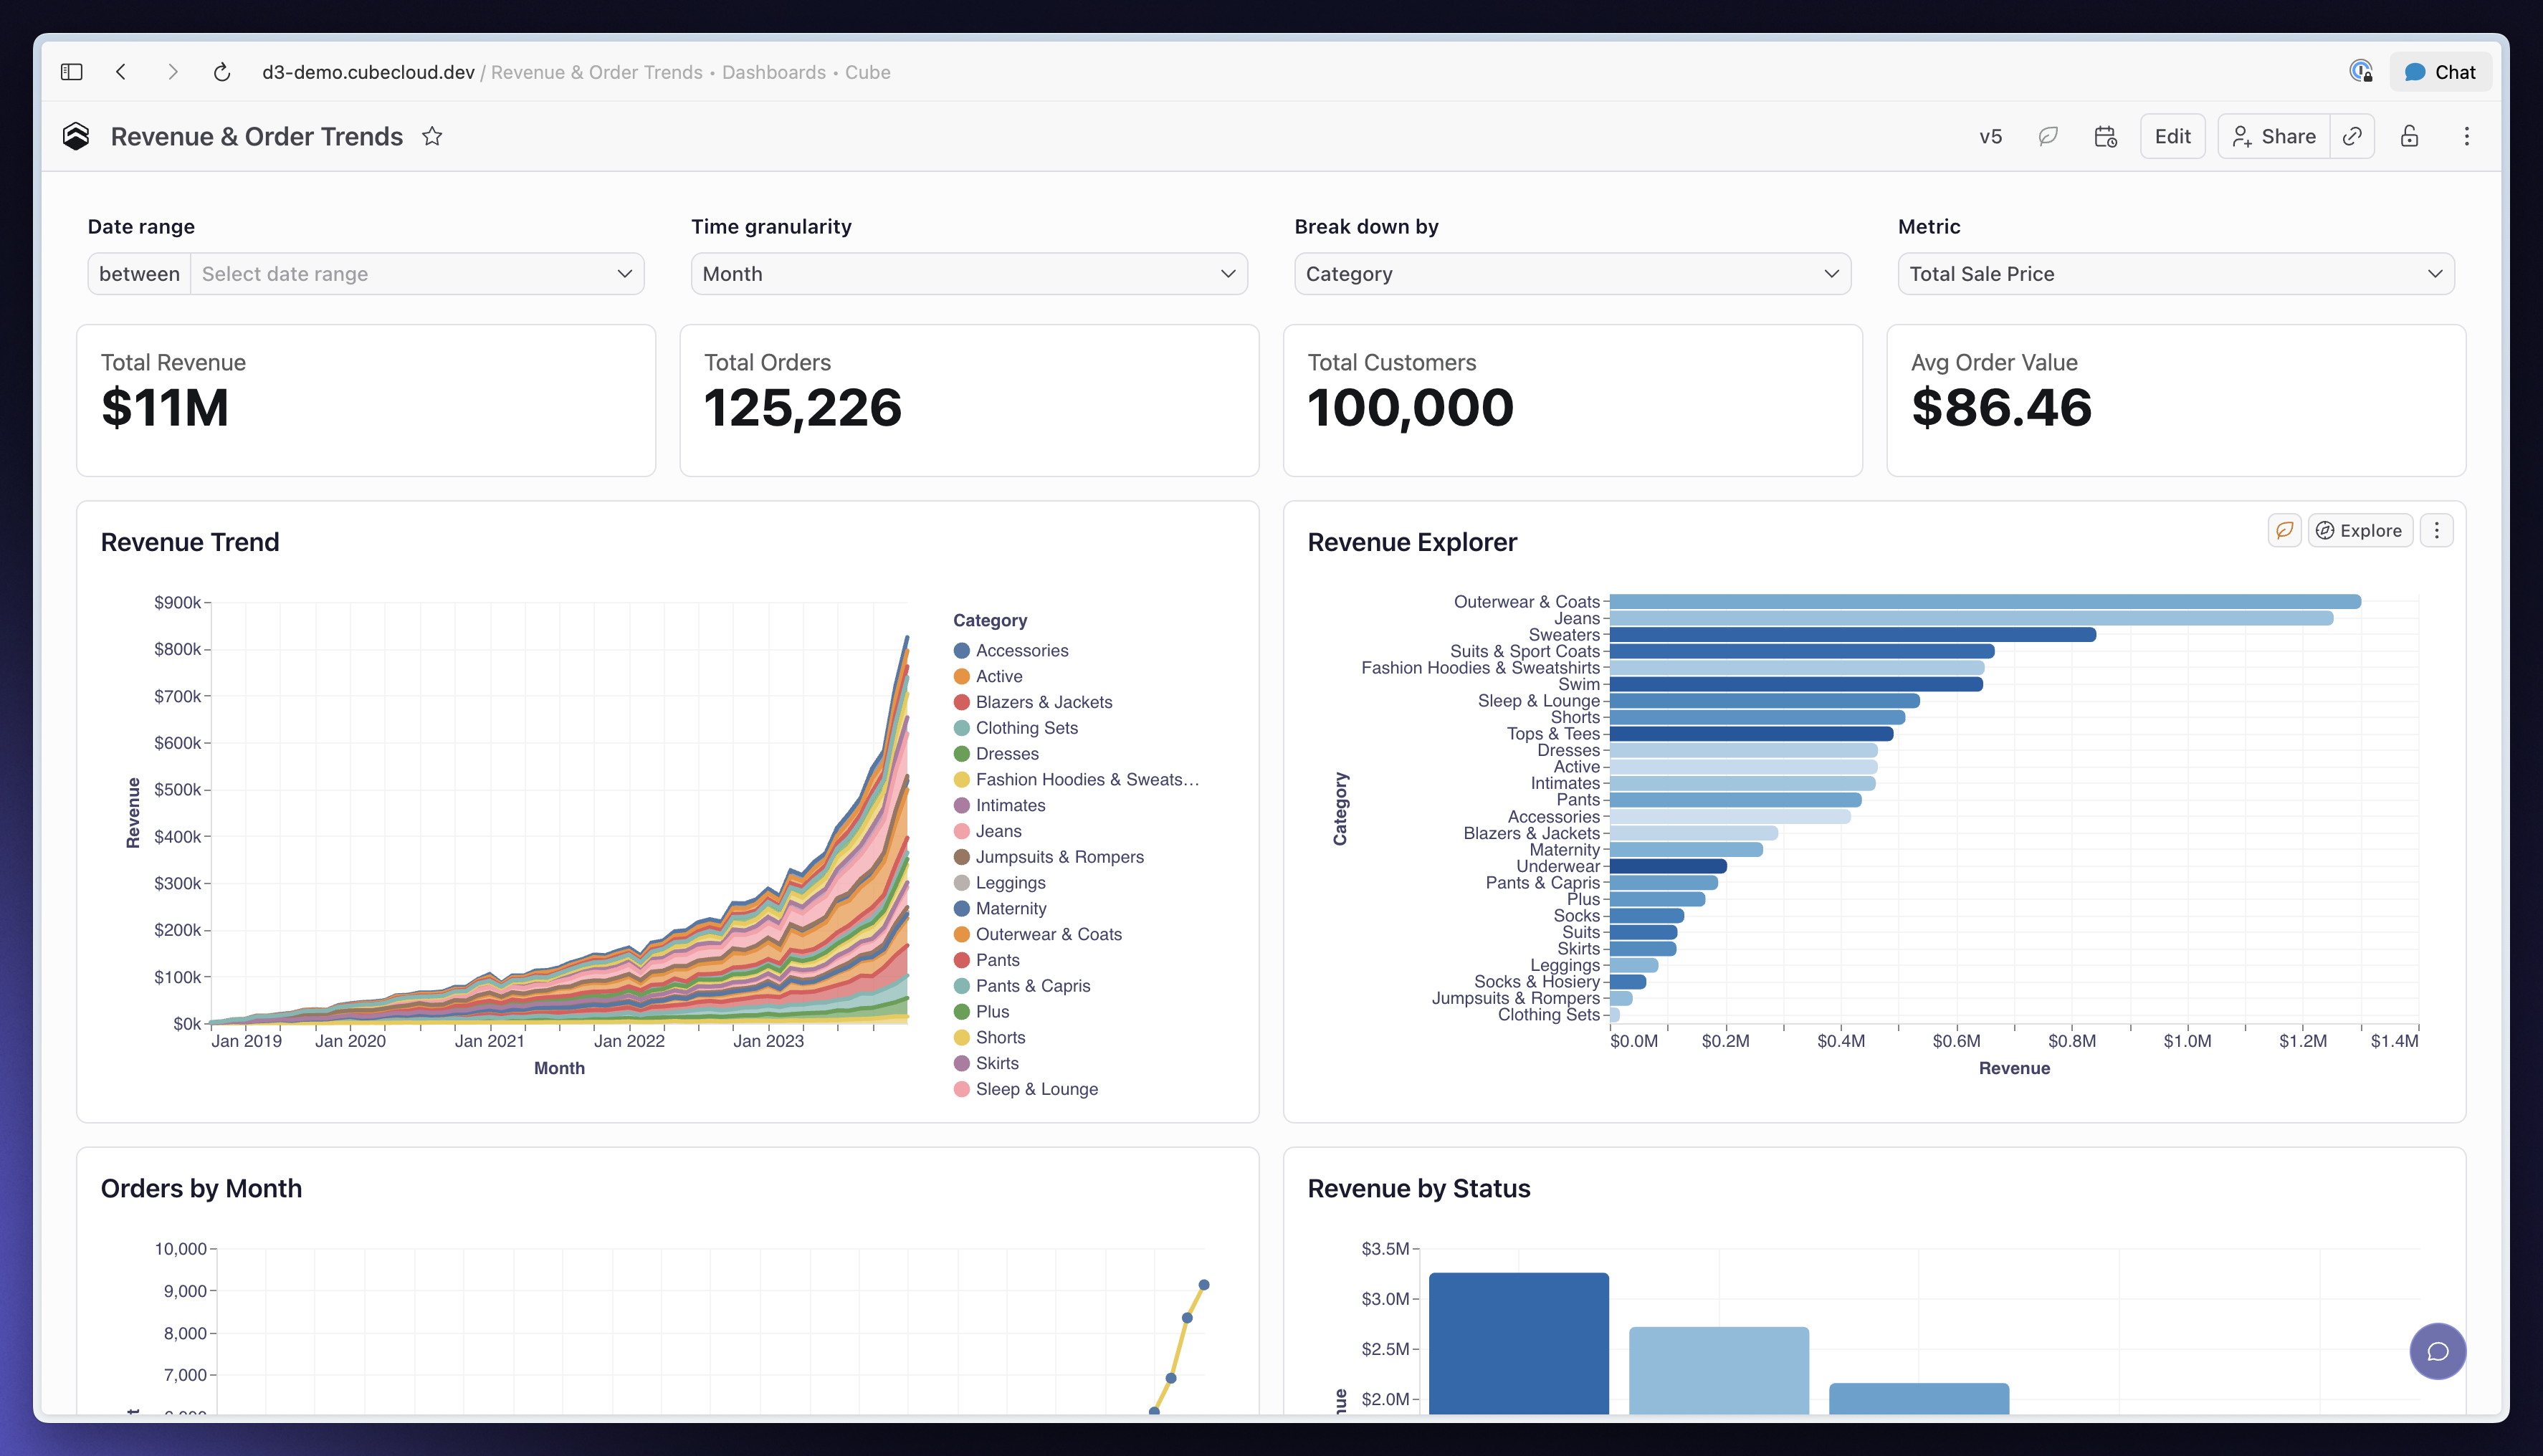
The Revenue & Order Trends dashboard below combines revenue, order, and customer metrics with charts for exploring changes over time. A teammate can open it in Cube, change the date range or time granularity, and compare departments, categories, or brands.
Get started
Follow the Cube agent skills setup, then ask CoCo to build a dashboard from a metric your team already uses.